ECE 280/Fall 2021/HW 02
Jump to navigation
Jump to search
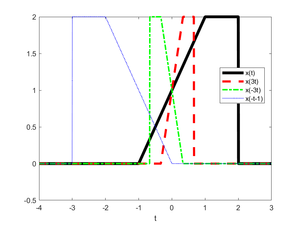
This page is meant as a support page for HW 02. The codes and graphs are for zyBook Challenge Activity 1.2.3
MATLAB
 1 %% Initialize workspace
 2 clear
 3
 4
 5 %% Define singularity functions
 6 u = @(t) (t>=0)*1;
 7 r = @(t) t.*u(t);
 8
 9 %% Define x(t)
10 x = @(t) r(t+1) - r(t-1) - 2*u(t-2);
11
12 %% Create time base
13 t = linspace(-4, 3, 1000);
14
15 %% Initialize figure
16 figure(1)
17 clf
18
19 %% Make plots
20 plot(t, x(t), 'k-', 'linewidth', 4), hold on
21 plot(t, x(3*t), 'r--', 'linewidth', 3)
22 plot(t, x(-3*t), 'g-.', 'linewidth', 2)
23 plot(t, x(-t-1), 'b:', 'linewidth', 1), hold off
24
25 %% Add label and legend
26 xlabel('t')
27 legend('x(t)', 'x(3t)', 'x(-3t)', 'x(-t-1)', 'location', 'best')
28
29 %% Save figure
30 print -dpng CA010203matlab_plot
Python
 1 # %% Import modules
 2 import numpy as np
 3 import matplotlib.pyplot as plt
 4
 5 # %% Define singularity functions
 6 u = lambda t: (t>=0)*1
 7 r = lambda t: t*u(t)
 8
 9 # %% Define x(t)
10 x = lambda t: r(t+1) - r(t-1) - 2*u(t-2)
11
12 # %% Create time base
13 t = np.linspace(-4, 3, 1000)
14
15 # %% Initialize figure and axes
16 fig = plt.figure(num=1, clear=True)
17 ax = fig.add_subplot(1, 1, 1)
18
19 # %% Make plots
20 ax.plot(t, x(t), 'k-', linewidth=4)
21 ax.plot(t, x(3*t), 'r--', linewidth=3)
22 ax.plot(t, x(-3*t), 'g-.', linewidth=2)
23 ax.plot(t, x(-t-1), 'b:', linewidth=1)
24
25 # %% Add label and legend
26 ax.set(xlabel='t')
27 ax.legend(['x(t)', 'x(3t)', 'x(-3t)', 'x(-t-1)'], loc='best')
28
29 # %% Save figure
30 fig.tight_layout()
31 fig.savefig("CA010203python_plot.png")

